Fig. 3.
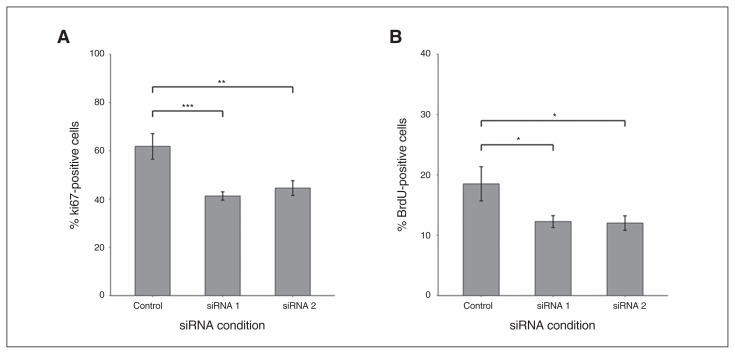
Decrease in cell proliferation markers in the CTX0E03 neural progenitor cell line in association with TCF4 small interfering RNA (siRNA) #1 and #2 conditions, as measured by high-content imaging. (A) Compared with the negative control siRNA condition, Ki67-positive cells were reduced by a mean of 33% in association with the TCF4 siRNA#1 condition (p < 0.001) and by a mean of 28% in association with the TCF4 siRNA#2 condition (p = 0.010). (B) Compared with the negative control siRNA condition, BrdU-positive cells were reduced by a mean of 34% in association with the TCF4 siRNA#1 condition (p = 0.017) and by a mean of 35% in association with the TCF4 siRNA#2 condition (p = 0.027); n = 12 per condition. Error bars represent standard errors of the mean. *p < 0.05, **p < 0.01, ***p < 0.001.

