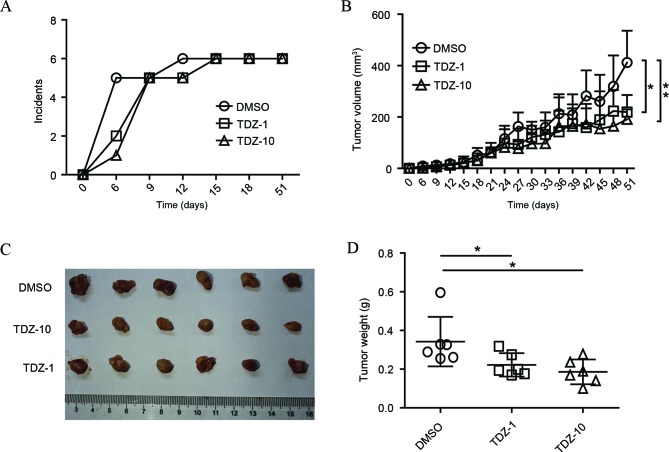
Figure 4.
TDZ suppressed tumor initiation and growth in vivo. (A) Comparison of tumor initiating ability on A549 sphere cells pre-treated with DMSO or TDZ (1 or 10 µM). The number of tumors was plotted against time following inoculation (day 0). The incidence indicated the number of mice with palpable tumor. (B) Growth curve of subcutaneous tumors with the indicated pre-treatment. (C) Tumor morphology with different treatments on day 51. (D) Measurement of tumor weights with indicated treatments on day 51. Tumor volume was measured every 3 days and the data shown represent the mean ± SD or mean + SD (n=6). The number of mice for each type of treatment was 6. *P<0.05, **P<0.01. TDZ, thioridazine; DMSO, dimethyl sulfoxide; SD, standard deviation; TDZ-1, thioridazine 1 µM; TDZ-10, thioridazine 10 µM.

