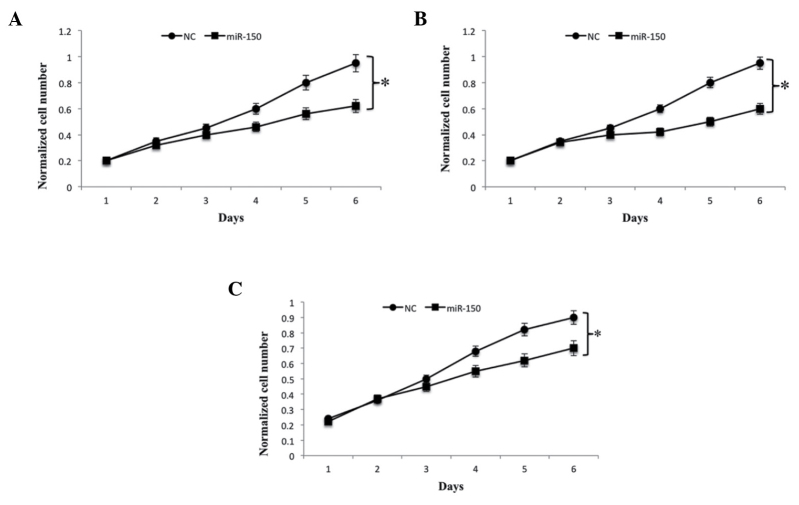
Figure 2.
miR-150 overexpression is inversely correlated with OS cell growth. (A) U2OS, (B) MG63 and (C) SaOS2 OS cell lines were transfected with miR-150 and the numbers of cells were determined at different time points using a fluorescence-based CyQUANT cell proliferation assay kit. In all cases, Student's t-test was used to analyze significant differences, *P<0.05. Data are presented as the mean + standard deviation. OS, osteosarcoma; miR, microRNA; NC, negative control.

