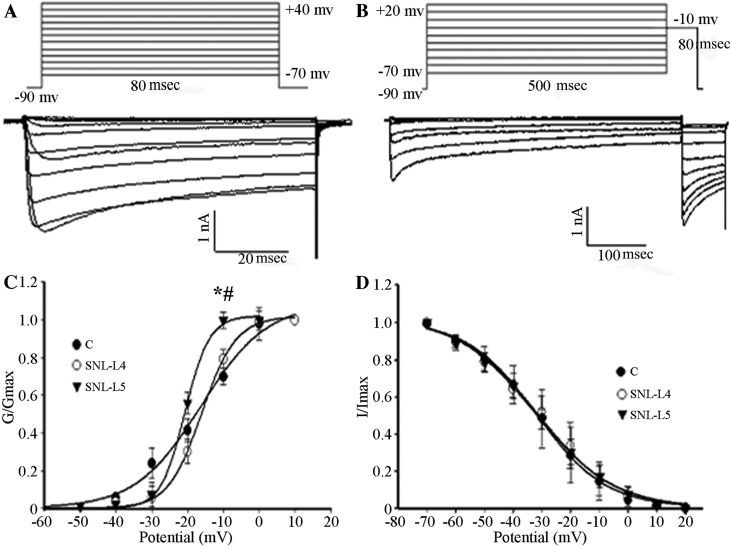
Figure 4.
(A) Activation. The membrane VH was set at −90 mV, calcium currents were elicited by a series of command voltages ranging from −70 to +40 mV with successive increments of 10 mV with 80-msec intervals. (B) Steady-state inactivation. Ca2+ currents were generated by the membrane VH at −90 mV for 10 msec, immediately followed by a series of command voltages from −70 to +20 mV with successive increments of 10 mV at 500-msec intervals. Subsequently, command voltages of −10 mV were applied at 80-msec intervals. (C) Activation curves were fitted using the Boltzmann equation (control neurons, n=10; adjacent neurons, n=5; axotomized neurons, n=8). A depolarized shift was observed in adjacent and axotomized neurons. Va1/2 of three groups was compared. *P<0.05 vs. control neurons. #P<0.05 regarding axotomized vs. adjacent neurons. (D) Inactivation curves were fitted using the Boltzmann equation (control neurons; n=6; adjacent neurons, n=6; axotomized neurons, n=7). Vi1/2 of three groups was compared. Values are expressed as the mean ± standard deviation. C, control; SNL, spinal nerve ligation; VH, holding potential; G, conductance; I, current; L4, adjacent neurons; L5, axotomized neurons.

