Figure 2.


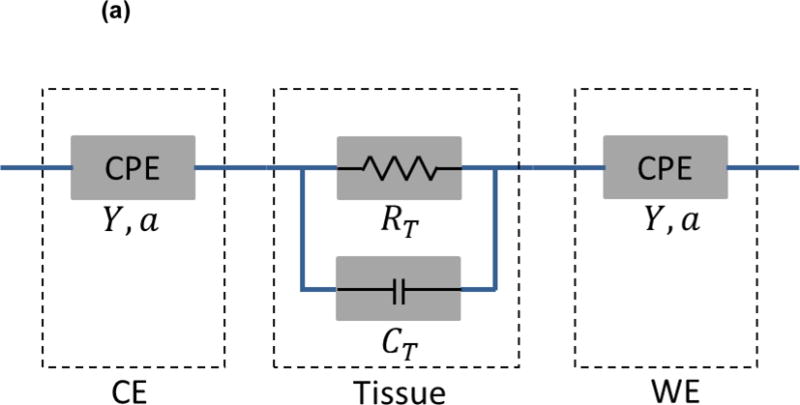
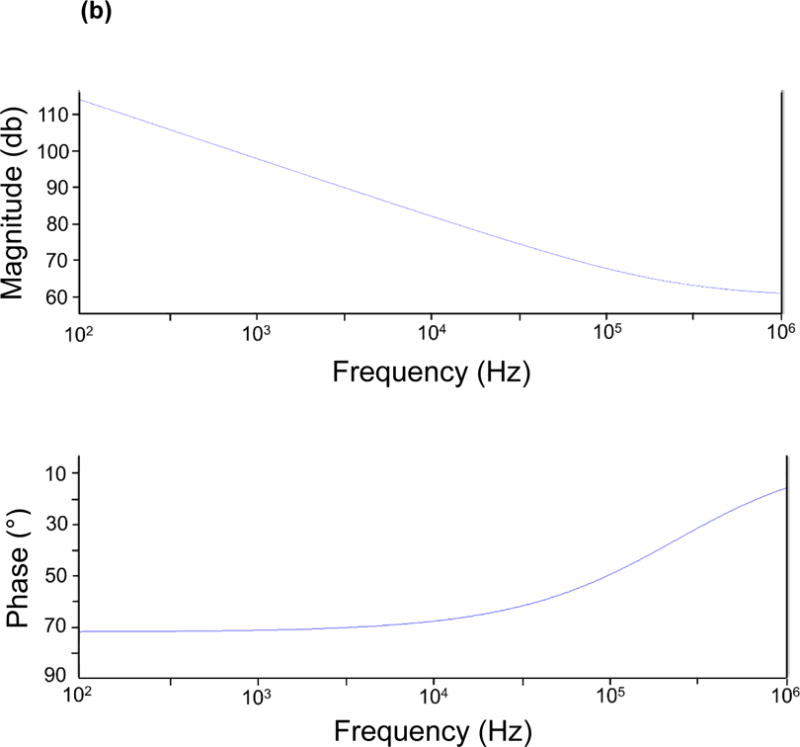
(a) Equivalent circuit diagram for the paired electrode sensor. a: constant between 0 and 1, corresponding to non-ideal interface effects between electrodes and tissues. CE: counter electrode. WE: working electrode. CPE: constant phase element. Y: nominal capacitance value. RT: resistive element. CT: capacitive element. (b) The Bode plot for the equivalent circuit model with component values: Y=100nS. RT=1kΩ. CT=10pF. a=0.8.
