Figure 3.


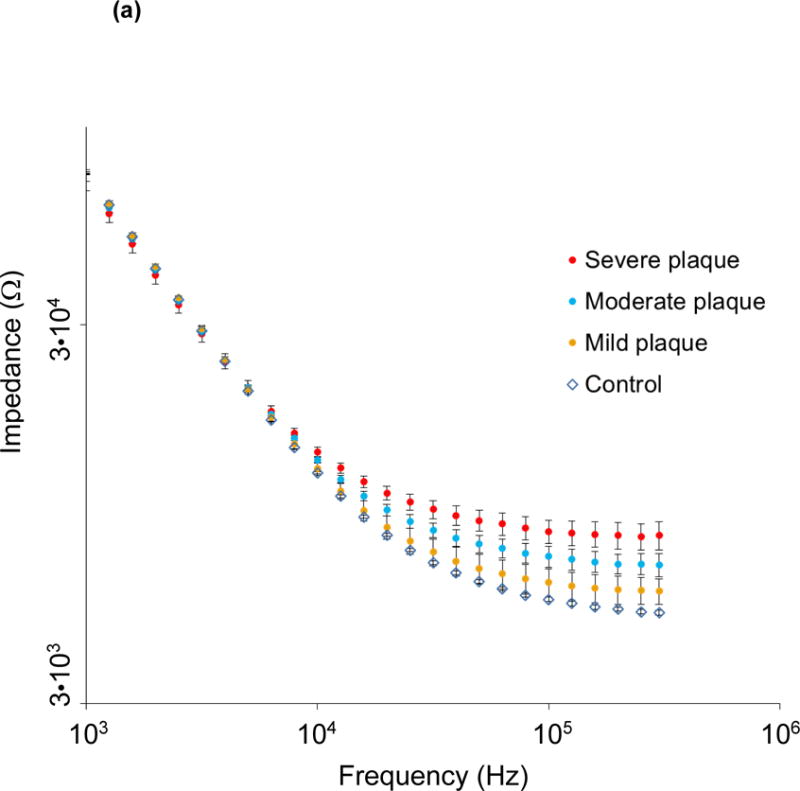
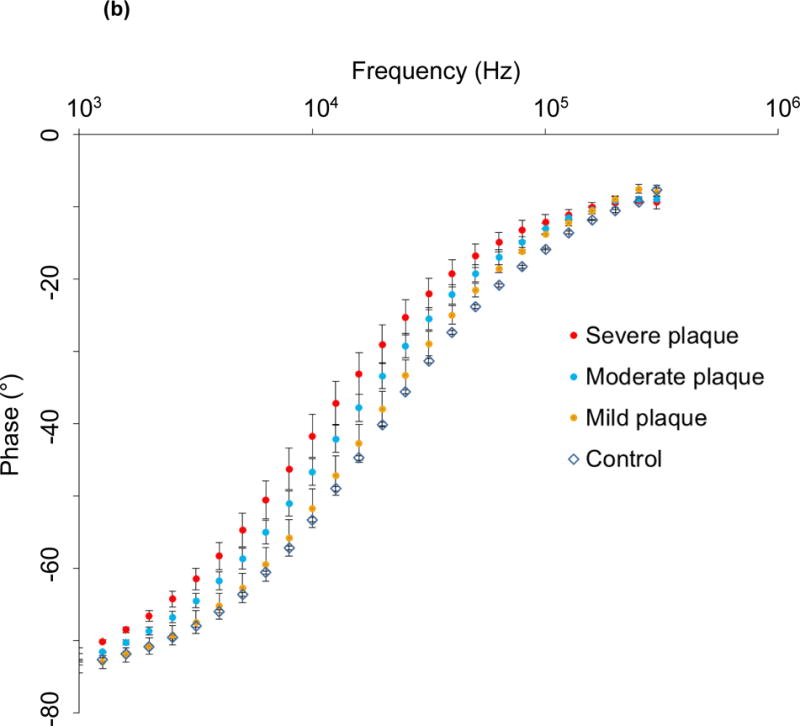
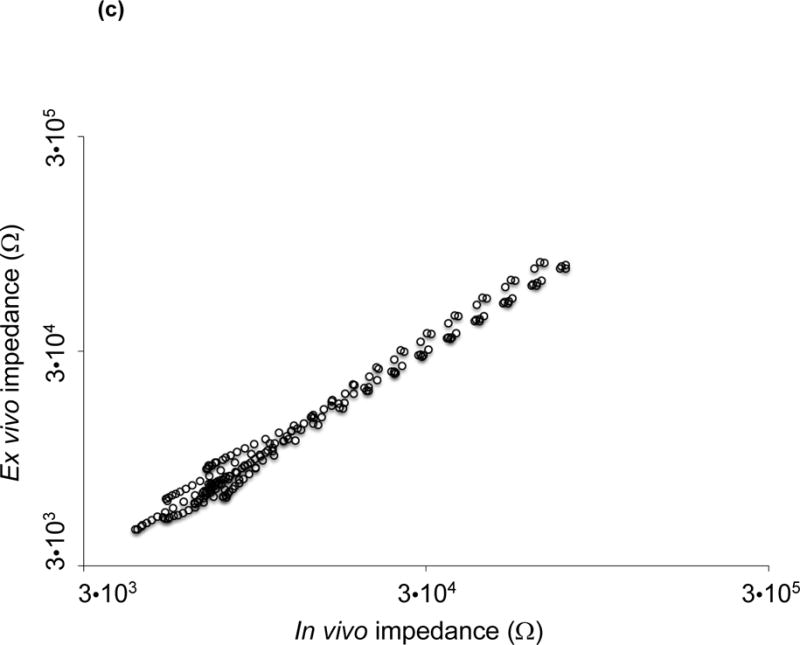
(a) Impedance magnitude in control aortas and aortic segments with mild, moderate and severe plaque are depicted in logarithmic scale. P < 0.05 in the frequency range 10 – 300 kHz for impedance profiles, Brown-Forsythe test. Data presented as means ± standard errors of the mean. (b) Phase spectra in control aortas and aortic segments with mild, moderate and severe plaque are depicted in logarithmic scale. P < 0.05 in the frequency range 1.5 – 125 kHz for phase spectra, Brown-Forsythe test. Data presented as means ± standard errors of the mean. (c) In vivo vs. ex vivo correlation of impedance spectra obtained from identical aortic segments with the EIS sensor. Spearman test r = 0.9732, P < 0.0001.
