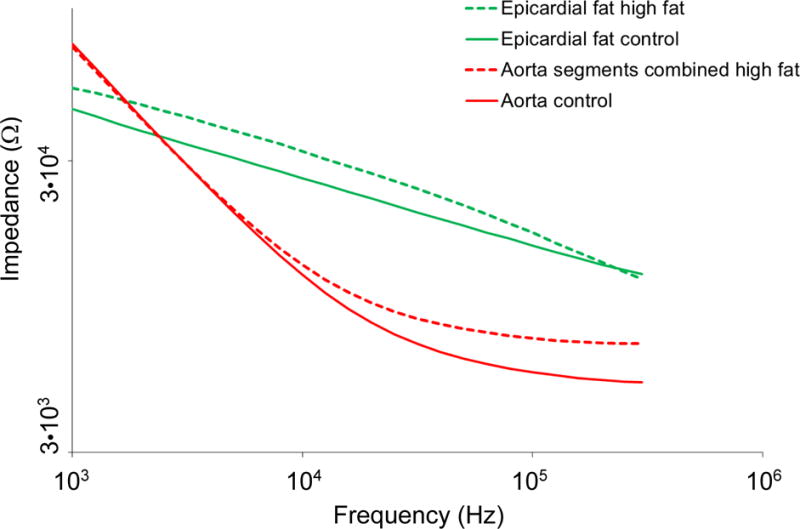
Figure 5.

Representation of combined EIS impedance spectra from aortas and epicardial fat. Control aortas, atherosclerotic aortas displayed as the mean value of all analyzed segments from various levels of the arterial tree and superimposed profiles of epicardial fat tissue demonstrate stark contrasts in EIS profiles and tissue impedance signatures across the frequency sweep. P < 0.05 throughout the frequency sweep from 1 kHz – 300 kHz in epicardial fat tissue compared to aortic segments, Brown-Forsythe test. P < 0.05 between control aortas and combined atherosclerotic plaque segments in the frequency range 10 – 300 kHz, Dunnett test.
