
Figure 6.
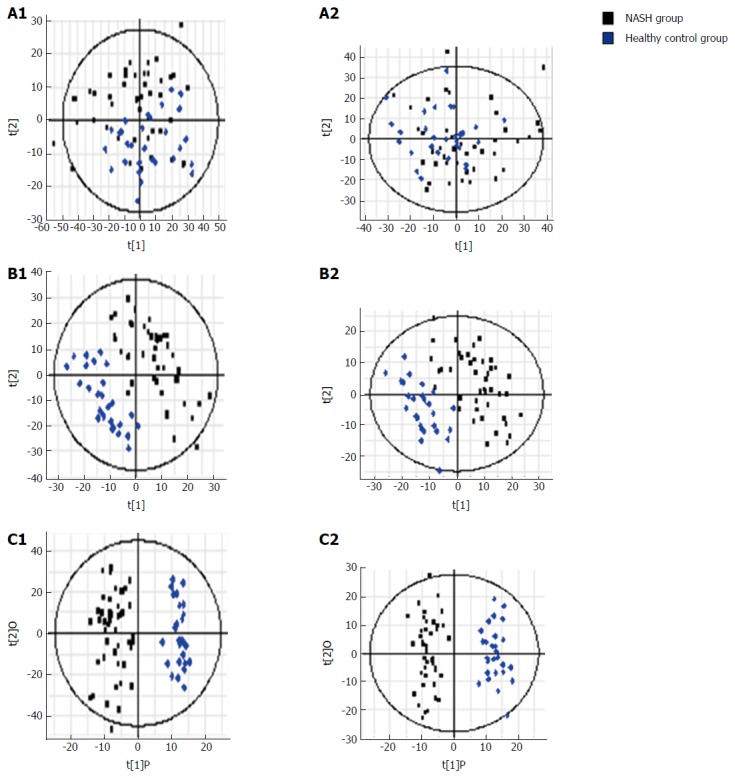
S-plots following (A) PCA, (B) PLS, and (C) OPLS analyses with (A1, B1, C1) electrospray ionization (ESI+) and without (A2, B2, C2) electrospray ionization (ESI-) in the non-alcoholic steatohepatitis and control groups. PCA: Principal component analysis; NASH: Non-alcoholic steatohepatitis.