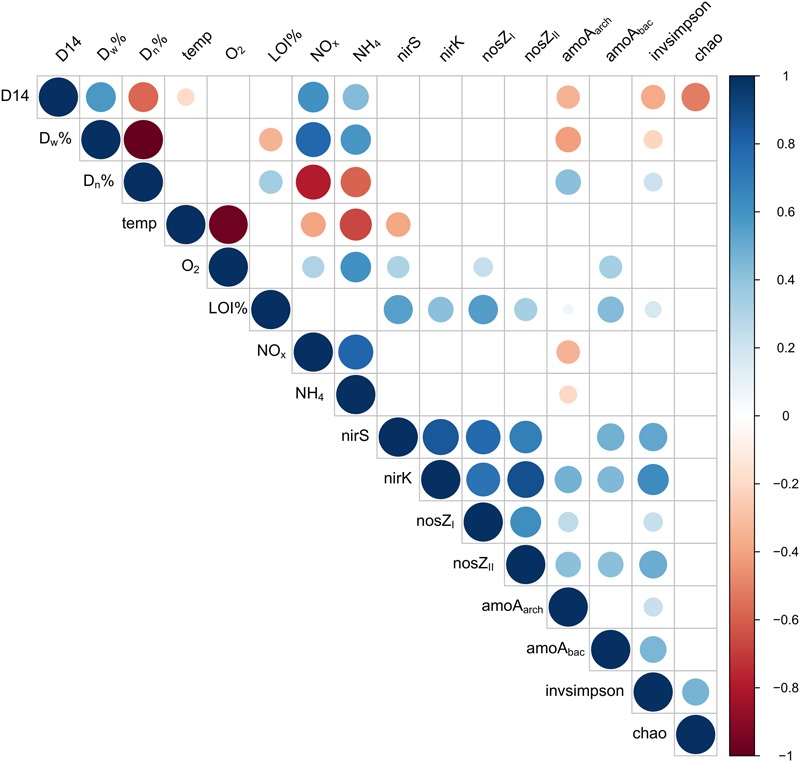
FIGURE 3.

Correlation plot describing interactions between total denitrification (D14), the proportion of denitrification of the NO3- in the water above the sediment (Dw%), the proportion of coupled nitrification-denitrification (Dn%), temperature, oxygen concentration, proportion of organic matter in the sediment (LOI%), nitrate concentration (NOx-), ammonium concentration (NH4+), abundances of functional genes (nirS, nirK, nosZI, nosZII, amoAarch, amoAbac) and bacterial diversity (Inverse Simpson index) and richness (chao richness estimator) on Keuruu study site.
