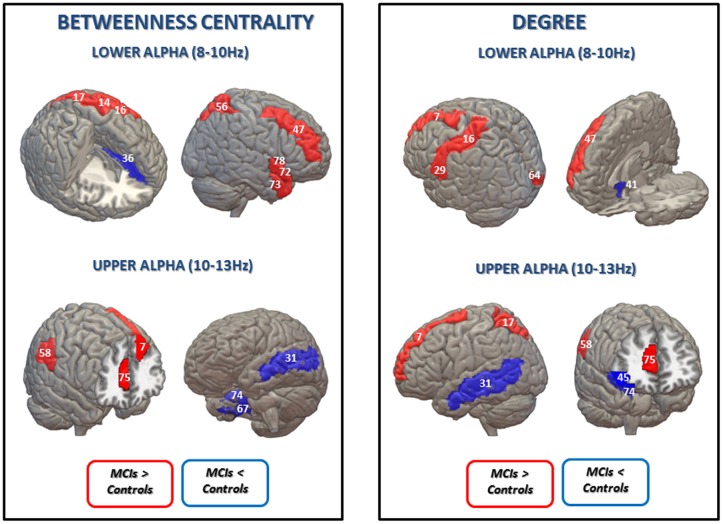
FIGURE 2.
Statistical differences between the control group and the MCI group in betweenness centrality (BC) (Left) and degree (Right) in lower and upper alpha bands (uncorrected for multiple comparisons). Blue is represented when MCIs exhibit lower BC values than the control group in: left anterior cingulate and paracingulate gyri (36) for lower alpha band; left middle temporal gyrus (31), right fusiform gyrus (67) and right parahippocampal gyrus (74) for the upper alpha band; and in degree values in: right olfactory cortex (41) for the lower alpha band; left middle temporal gyrus (31), right inferior frontal gyrus, orbital part (45) and right parahippocampal gyrus (74) for the upper alpha band. Red is represented when the MCI present higher BC values in: left precentral gyrus (14), left postcentral gyrus (16); left superior parietal gyrus (17), right middle frontal gyrus (47), right superior parietal gyrus (56), right temporal pole: superior temporal gyrus (72), right temporal pole: middle temporal gyrus (73) and right Insula for the lower alpha band; left superior frontal gyrus, dorsolateral (7), right supramarginal gyrus (58), and right anterior cingulate and paracingulate gyri (75) for the upper alpha band; and higher degree values in: left superior frontal gyrus, dorsolateral (7), left postcentral gyrus (16), left Heschl gyrus (29) and right middle frontal gyrus (47) for the lower alpha band; left superior frontal gyrus, dorsolateral (7), left superior parietal gyrus (17), right supramarginal gyrus (58) and right anterior cingulate and paracingulate gyri (75) for the upper alpha band. AAL numbers appear in parentheses.

