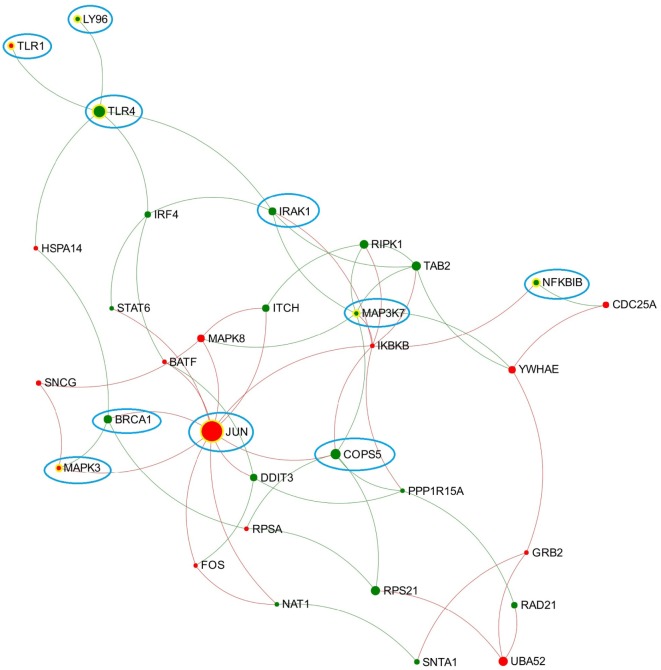
Figure 2.
Expression patterns of the toll-like receptor (TLR) 3/4-associated subnetwork extracted from data representing chronic stage of Fasciola hepatica infection. Red and green nodes represent genes showing increased and decreased expression, respectively. The size of nodes is proportional to their betweenness centrality values. Several nodes that consistently presented in the TLR3/TLR4-associated subnetworks (generated from acute and chronic stages of infection, respectively) are highlighted with blue cycle.

