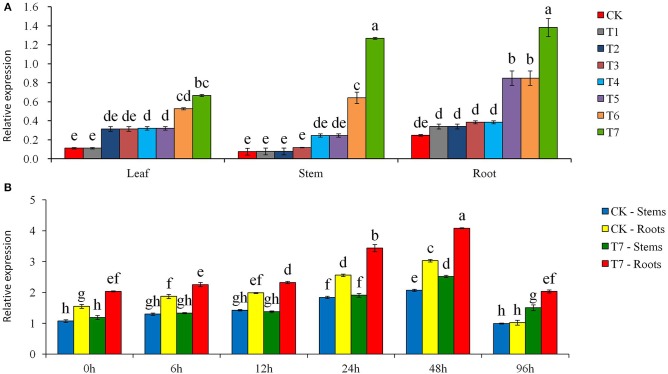
Figure 1.
Expression of StPIP1 gene with quantitative real-time PCR. (A) Assay of tissue-specific expression of StPIP1 gene in transgenic (T1 to T7) and non-transgenic (CK) potato plants, and T7 root was normalization factor, (B) Effects of mannitol-induced osmotic stress treatments on the relative quantity of expression levels of the StPIP1 gene in the transgenic line T7 (as an example) and non-transgenic control potato plants, and CK stem in 0 h stress was normalization factor. Significant differences among means over the period (h) of mannitol stress treatments were determined according to Tukey's HSD test at P < 0.05. The line bars are standard errors (n = 9, i.e., 3 replicates × 3 runs of the experiment).

