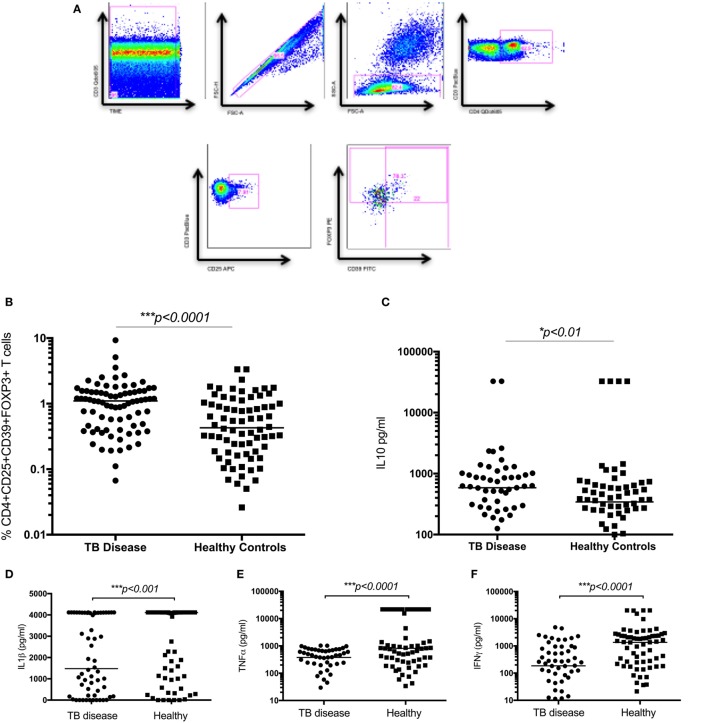
Figure 2.
Regulatory T cells and the related cytokine IL10 are significantly increased in children with tuberculosis (TB) disease compared to healthy controls. (A) Gating strategy. From left to right, CD3 vs Times is shown to detect differences in flow. Cell doublets were excluded with forward scatter area vs forward scatter height parameters. Plotting FSC-A vs SSC-A allows identification of the lymphocyte population based on size and granularity. CD4+CD3+ T cells are identified, followed by CD4+CD25+ T cells. Using FMO gates, FOXP3 and CD39 gates are placed to identify the CD3+CD4+CD25+CD39+FOXP3+ population. Frequency of CD4+CD25+CD39+FOXP3+ regulatory T cells in unstimulated whole blood (B) and the secreted level of a key cytokines following 6 days of stimulation with BCG (C–F) are shown. The assays were performed for both groups: TB disease (n = 76) and healthy children (n = 83). Horizontal bars represent median values. p-Values calculated by a Mann–Whitney test are displayed.

