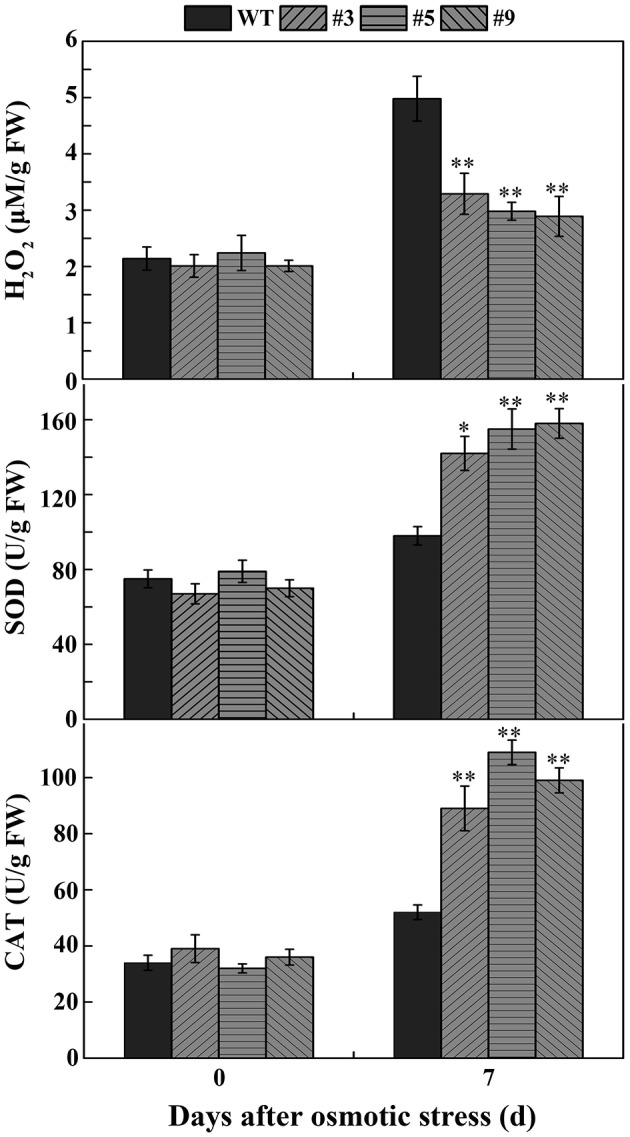
Figure 5.

The H2O2 accumulation and the activity of SOD and CAT in transgenic lines and WT under normal conditions and osmotic conditions. Each value is the average of three replicates, and error bars represent ±SD. * and ** represent significant differences between transgenic lines and WT at P < 0.05 and P < 0.01, respectively.
