FIGURE 11.

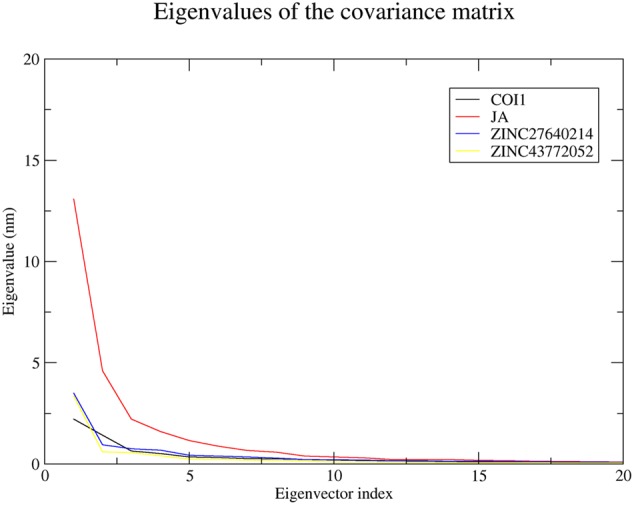
The eigenvalues plotted of the first 20 eigenvector obtained from the C-α covariance matrix constructed from last 10 ns trajectory.

The eigenvalues plotted of the first 20 eigenvector obtained from the C-α covariance matrix constructed from last 10 ns trajectory.