FIGURE 4.

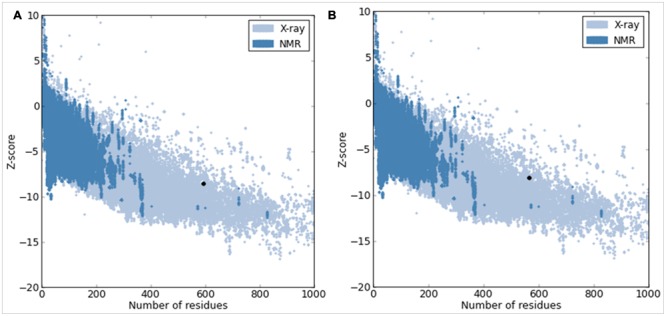
Protein Structure Analysis (ProSA) of model COI1. (A) Overall quality of COI1 model showing a z-score of –8.59 (Native conformation to its template). (B) Overall quality of template (3OGK_B) model showing a z-score of –8.13.

Protein Structure Analysis (ProSA) of model COI1. (A) Overall quality of COI1 model showing a z-score of –8.59 (Native conformation to its template). (B) Overall quality of template (3OGK_B) model showing a z-score of –8.13.