FIGURE 8.

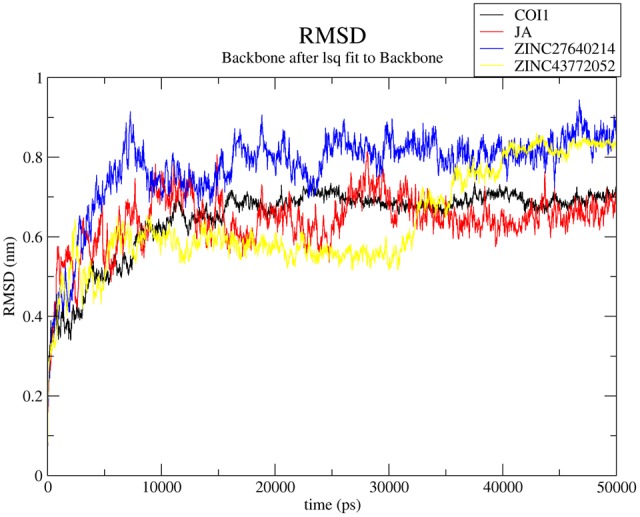
Time dependent root mean square deviation (RMSD) of C-α backbone of the COI1 and its complexes. Black, red, blue, and yellow color represents COI1, COI1-JA, COI1-ZINC27640214, and COI1-ZINC43772052, respectively.

Time dependent root mean square deviation (RMSD) of C-α backbone of the COI1 and its complexes. Black, red, blue, and yellow color represents COI1, COI1-JA, COI1-ZINC27640214, and COI1-ZINC43772052, respectively.