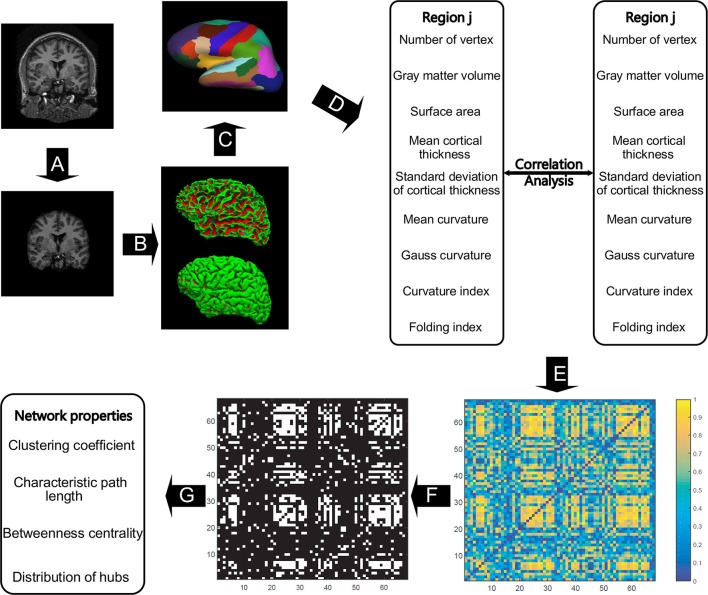
Figure 1.
The general flowchart of the individual-based morphological brain network construction and analyses. The steps from (A–D) were accomplished using FreeSurfer. Intensity bias was corrected, and the skull was stripped (A) before the inner and outer surfaces of gray matter were extracted (B). All the involved morphometric features were first measured between inner and outer surfaces (C), and then the feature results were mapped to the Desikan–Killiany cortical atlas to obtain the regional feature measurements (D). For each region, nine morphometric features were concatenated as a feature vector to obtain the correlation coefficient between any two regions to frame the individual-based morphological connectivity (E). The connection matrix was then repeatedly binarized based on the sparsities (from 20 to 40% with a step size of 1%) to generate the network graphs (F), and then the network topological properties were analyzed in accordance with graph theory (G).

