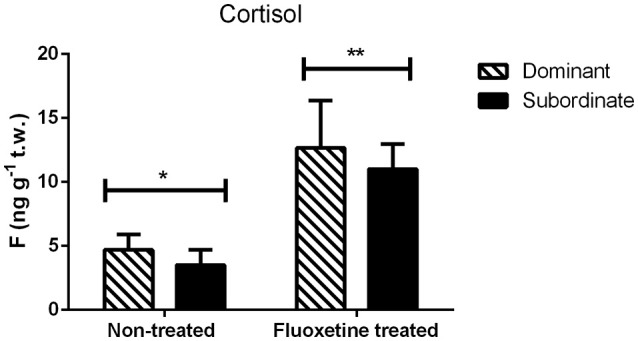
Figure 2.

Trunk cortisol (F) concentrations (mean ± S.E.M., n = 8 per group) in non-treated and fluoxetine treated pairs. Statistical analysis performed using two-way ANOVA. Different asterisks indicate statistically significant differences among the two treatments (fluoxetine or non-treated groups).
