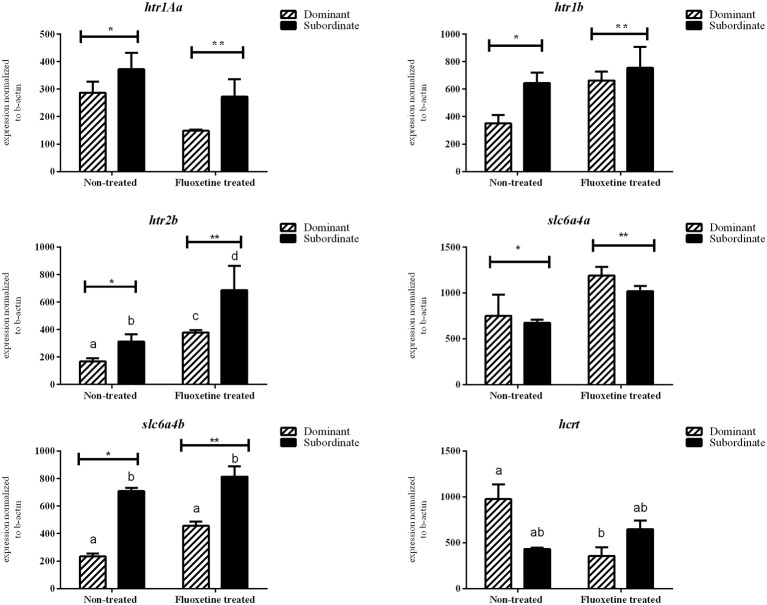
Figure 4.
Relative mRNA expression levels (mean ± S.E.M., n = 4 pools of two brains) of htr1Aa, htr1b, htr2b, slc4a6a, slc4a6b, hcrt whole brain samples. Different letters indicate statistically significant differences in all pairwise multiple comparison procedures, while asterisks differences among the two treatments (fluoxetine or non-treated groups).

