
FIGURE 1.
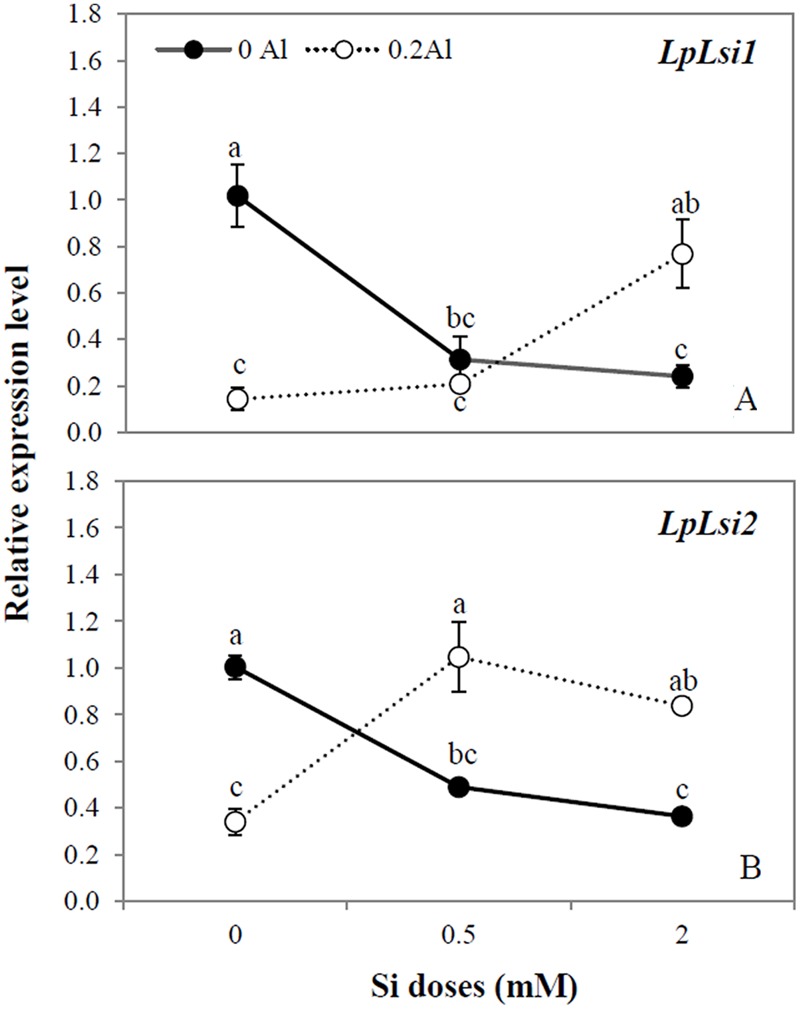
Expression analysis of LpLsi1 (A) and LpLsi2 (B) genes determined by qRT-PCR in roots of ryegrass hydroponically cultivated under Al and Si treatments. The expression levels were normalized in relation to Actin or eEF1A(m) gene expression. Data are means of three replicates @ standard error. Different letters indicate statistically significant differences (p ≤ 0.05) among treatments.