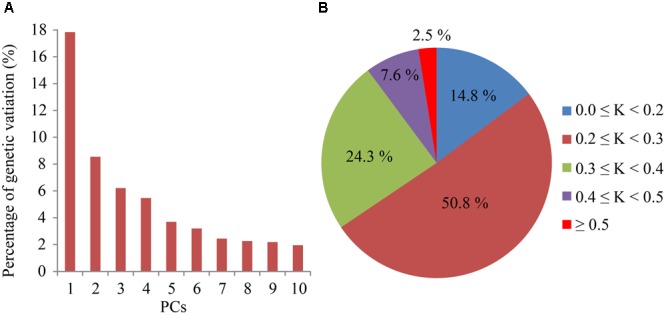
FIGURE 1.

Principal component analysis and relative kinship analysis of the indica population. (A) The percentage of genetic variation explained by each of the first 10 principal components (PCs). (B) Distribution of relative kinship among 432 indica accessions, K represents relative kinship coefficients.
