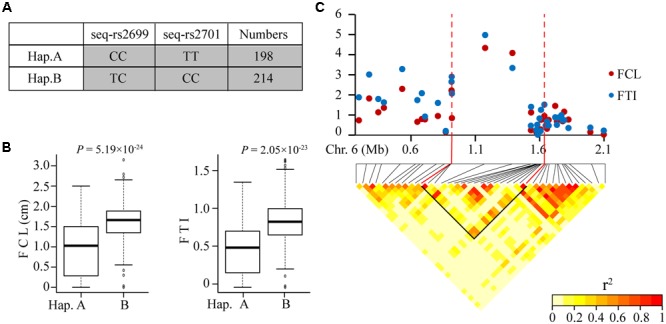
FIGURE 3.

Statistical analysis and candidate region estimation of seq-rs2699 and seq-rs2701. (A) Haplotypes consist of the two significant SNPs, Numbers indicates the amounts of corresponding accessions; (B) Phenotypic effect of each haplotype; (C) Local manhattan plots and LD heatmap around the peak on chromosome 6, the candidate region estimated using r2 > 0.6.
