
FIGURE 4.
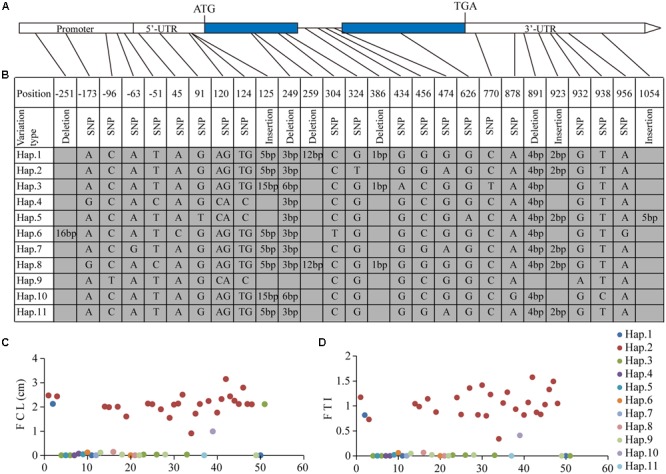
Analysis of candidate gene LOC_Os06g03520. (A) Gene structure of LOC_Os06g03520, the blue regions show the exons; (B) eleven haplotypes detected in 51 varieties with extreme phenotypes; (C,D) phenotypic distribution of the 51 varieties, x-axis indicates numbers sort by accessions ID; y-axis represents phenotypes. (C) FCL, flooded coleoptile length, (D) FTI, flooding tolerance index.