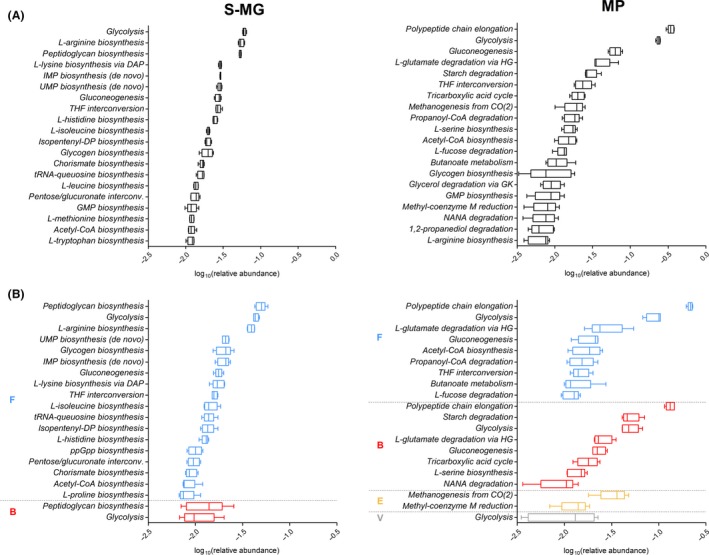
Figure 3.

Metabolic pathway potential and activity of the sheep faecal microbiota, as measured by metagenomics (S‐MG, left) and metaproteomics (MP, right) respectively. (A) Tukey's box plot illustrating the 20 most relevant pathways, based on the related gene (left) and protein (right) abundance. (B) Tukey's box plot illustrating the 20 most relevant pathway–phylum combinations, based on the related gene (left) and protein (right) abundance. Pathways are grouped based on the relative phylum (B, Bacteroidetes; E, Euryarchaeota; F, Firmicutes; V, Verrucomicrobia) and further ordered by decreasing mean relative abundance.
