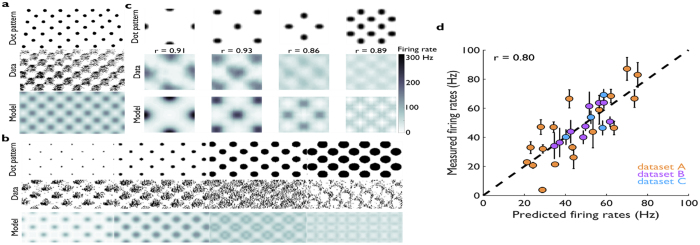
Figure 2. Measured and reconstructed neuronal responses.
(a) Top: Example dot pattern for which measured SA1 responses were available. Middle: SEP constructed from measured responses. Bottom: SEP constructed from simulated strains (adapted from Connor et al.4). (b) Top: Four dot patterns used in a separate experiment. Middle: Corresponding SEPs constructed from measured neural responses to these patterns. Bottom: SEPs constructed from simulated strains. Both sets of SEPs transition from faithful snapshots of dots (left) to “holes” in the pattern of spiking at dot locations (right) (adapted from Blake et al.3). (c) Top: Dot patterns; Middle: SEPs constructed from smoothed measured responses; Bottom: SEPs constructed from simulated strains. Pixel-by-pixel correlation coefficients between model and measurement are shown above each pair of SEPs. (d) Measured vs. predicted overall mean firing rates of SA1 afferents in response to each texture from datasets A4, B3 and C6. Error bars depict standard error of the mean for measured rates.

