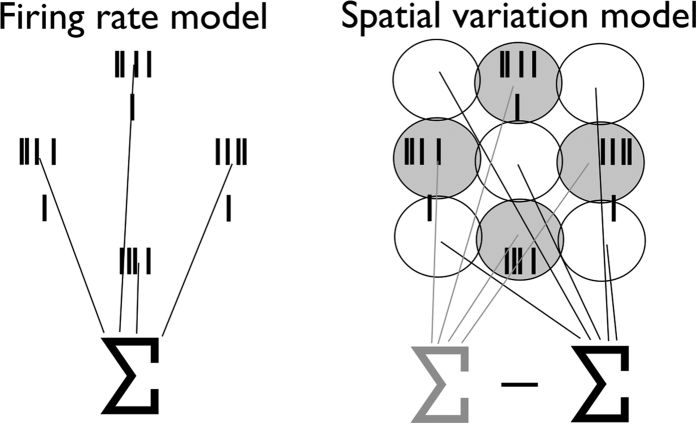
Figure 3. Schematic of roughness models.
Left: According to the firing rate model, all spikes, regardless of spatial location, are summed to generate a roughness percept. Right: According to the spatial variation model, the differences in spike counts evoked in spatially displaced SA1 afferents (at a distance of approximately 2 mm) determines roughness.

