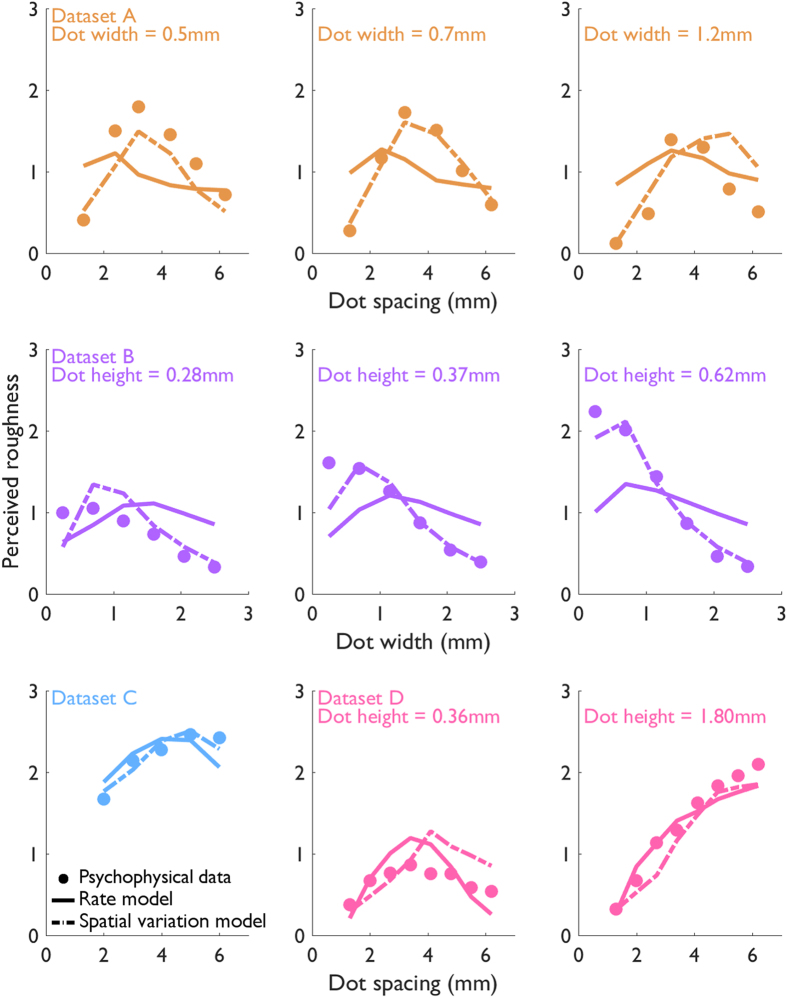
Figure 4. Measured and predicted roughness.
Normalized roughness judgments obtained in psychophysical experiments (circles) along with roughness predicted by the mean rate (solid lines) and spatial variation (dashed lines) models. Orange: dataset A4; Purple: dataset B3; Blue: dataset C6; Pink: dataset D7.

