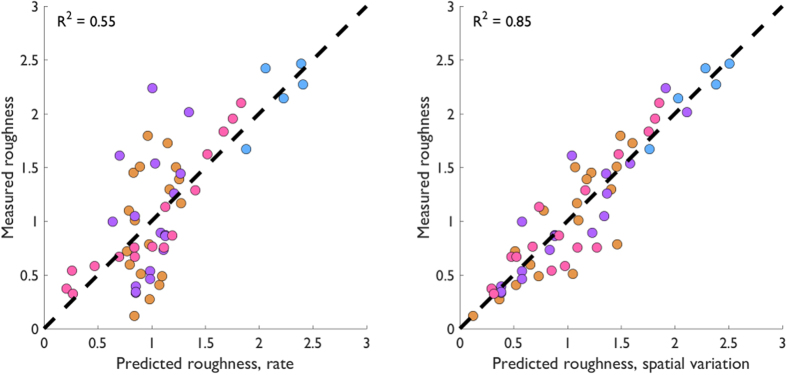
Figure 5. Firing rate and spatial variation model predictions.
Measured vs. predicted roughness for the firing rate model (left) and spatial variation model (right). The spatial variation model provides more accurate predictions than does the firing rate model across all conditions tested. Colors indicate separate datasets using the same conventions as in Figs 2 and 4.

