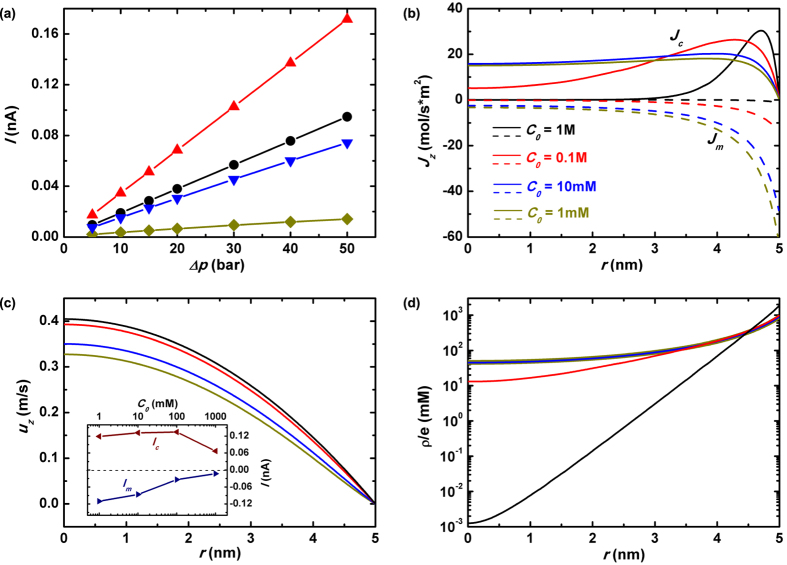
Figure 4. Nanopore streaming conductance.
(a) The ionic current I versus the imposed cross-pore pressure Δp in a Rp = 5 nm and Lp = 40 nm nanopore under various salt concentrations. The pore-radial distribution of the z-component ionic fluxes Jz (b), fluidic velocity uz (c) and net charges ρe/e (d) at z = 0 nm with a longitudinal driving pressure Δp = 30 bar. Besides, in (b) the real lines characterize the convection flux Jc while dash lines represent the electrophoretic flux Jm which are defined as Jm(c) = Jm(c),+ − Jm(c),−. The inset of (c) plots the components of electrical current due to the ionic convection Ic and electro-migration Im as functions of the imposed salt concentrations. The former is marked by the wine line with left-triangle symbols, while the latter by the navy line with right-triangle symbols.

