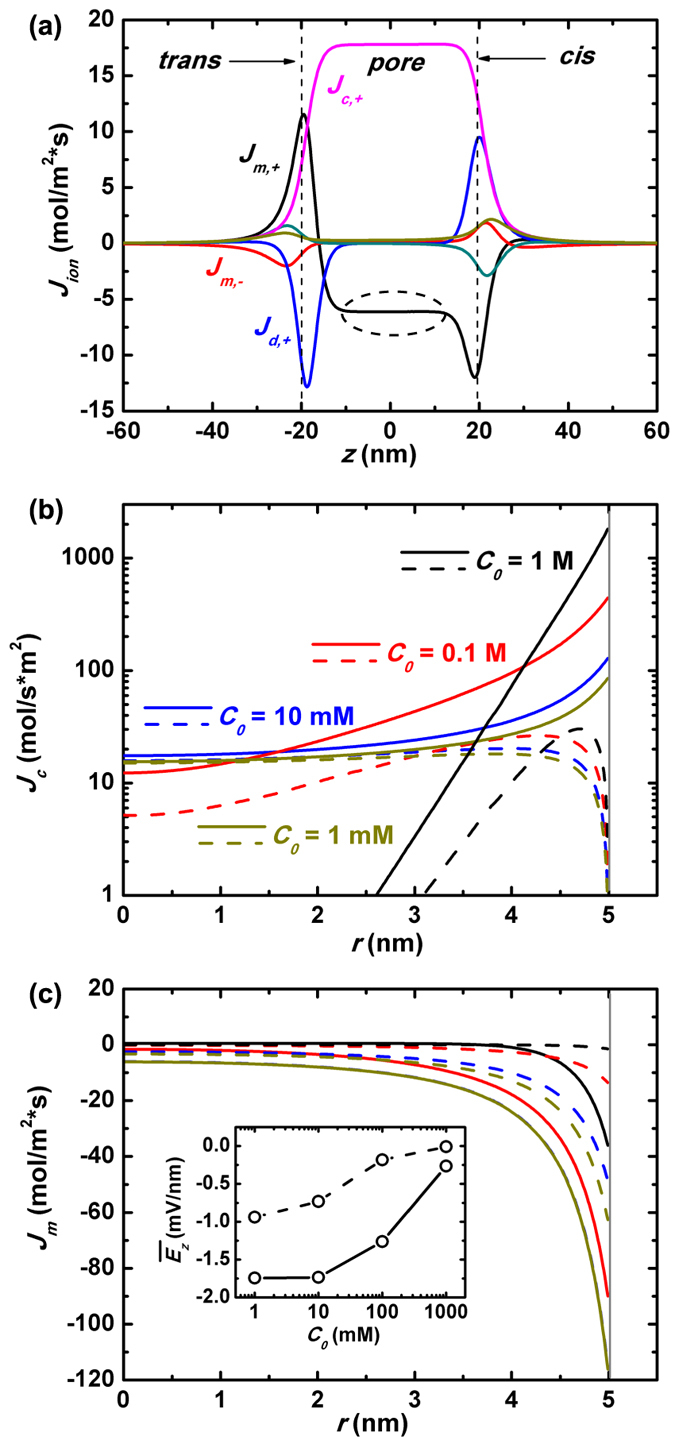
Figure 6. Streaming conductance in a slippery nanopore.

(a) The distribution of various components of z-component ionic flux Jz along z0 under salt concentration C0 = 10 mM. (b) and (c) The pore-radial distribution of the convection ionic flux Jc(r) and electrophoretic flux Jm(r), where the real lines are for the slippery nanopore while the dash lines are for the non-slip nanopore. The inset of (c) plots the pore-radial averaged electric driving field  at z = 0 as a function of the imposed salt concentration C0, where the real line with symbols is for the slippery nanopore and the dash line for the non-slip one.
