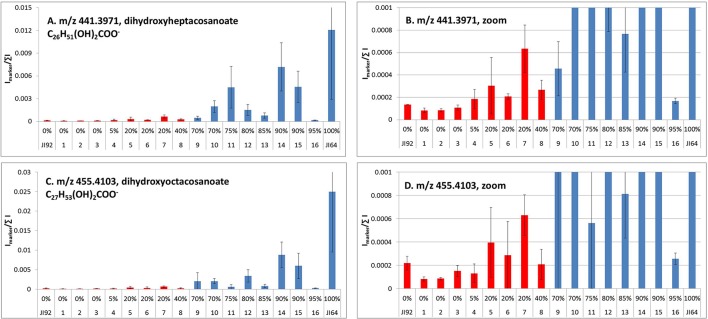
Figure 6.
LDI-MS analysis of dihydroxyheptacosanoate (A) and dihydroxyoctacosanoate (C) in seed coats of contrasting parents (JI64, JI92) and selected RILs (intensity of signals at particular m/z-values normalized to sum of all signals in mass spectrum; red, non-dormant; blue, dormant lines; error bars reflect the standard deviation of three replicated measurements, α = 0.05); (B,D), zoomed graphs.

