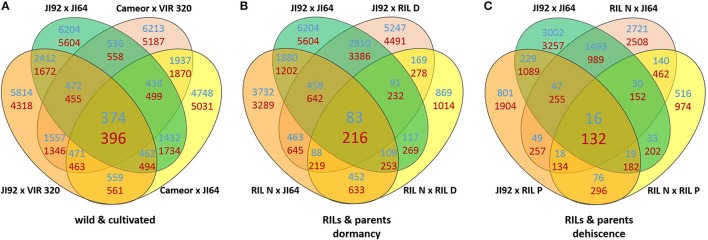
Figure 7.
Venn diagrams of differentially expressed genes (DEGs criteria log2 FC ≥ 2 and FDR ≥ 0.01) between seed coat (A) of the studied wild and cultivated genotypes, (B) and JI64, JI92 parents and resulting RILs and (C) between pod sutures of JI64, JI92 parents and resulting RILs. Blue counts are upregulated and red counts are downregulated in cultivated genotypes.

