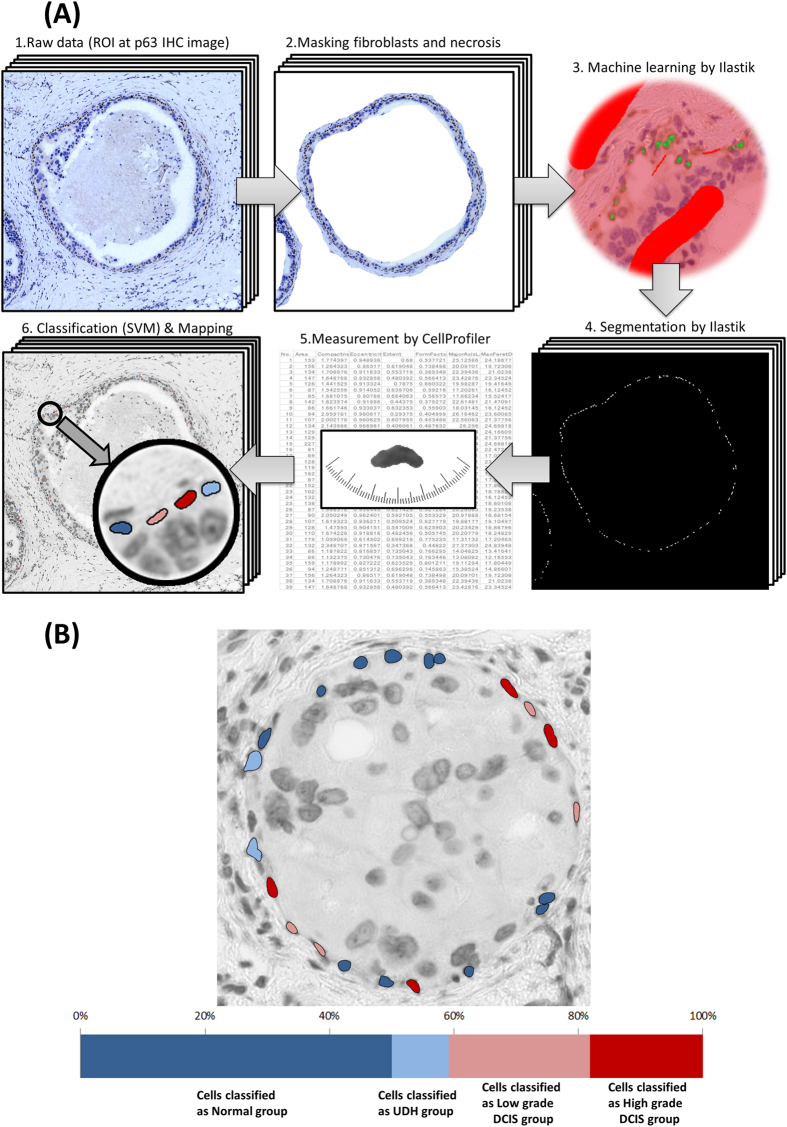
Figure 1.
(A) Flowchart of image analysis on p63 immunohistochemistry images. 1 All slides were scanned by a whole slide image (WSI) scanner and a total of 70 ROIs were selected manually from p63 immunohistochemistry images. 2. To select only myoepithelial cell nuclei, we masked fibroblasts in interstitial tissue and inside the ducts as well as necrosis. 3. We applied Ilastik (segmentation software) to these ROIs. This is the training phase of machine learning for segmentation. 4. Segmentation by the trained Ilastik is applied to other images. 5. Each cell was measured using CellProfiler. 6. High dimensional morphological features of each cell were applied to machine learning, support vector machine (SVM). Based on the result of SVM classification, myoepithelial cell nuclei are drawn in different colors. (B) Example of heterogeneity of myoepithelial cells within a duct. Myoepithelial cells are marked by each histologic type based on classification of SVM: dark blue (myoepithelial cells classified as normal group), light blue (cells classified as UDH group), light red (cells classified as LG-DCIS group), dark red (cells classified as HG-DCIS group). A bar graph shows the proportion of each classified cell type in the duct.

