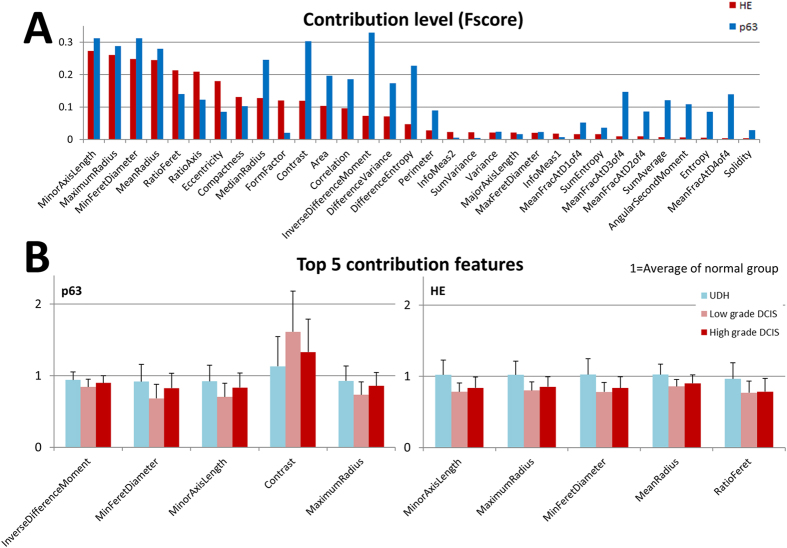
Figure 2.
(A) Contribution level of each morphological feature. The F-score denotes the discrimination power of each individual feature. Red bar: F-score on the HE stained image, blue bar: F-score on the p63 immunohistochemistry images. (B) Top 5 contribution features. Ratio of top 5 contribution feature’s average value with standard deviation (1 = Average of normal group). Light blue (cells classified as UDH group), light red (cells classified as LG-DCIS group), dark red (cells classified as HG-DCIS group).

