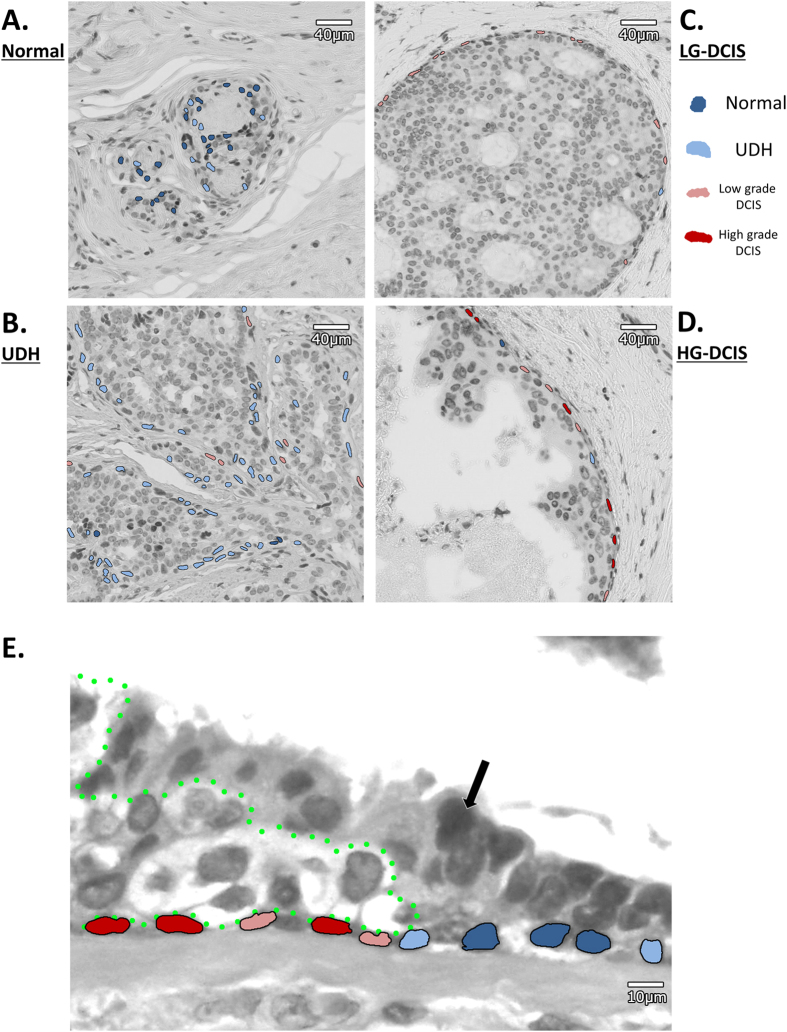
Figure 3. Representative examples of heterogeneity mapping of myoepithelial cells.
(A) Normal area, (B) UDH area, (C) LG-DCIS area, (D) HG-DCIS area. (E) Edge area of DCIS. Neoplastic cells push through between normal luminal cells and myoepithelial cells. Black arrow: Normal epithelial cell. Cells surrounded by green dot line: neoplastic cells. Dark blue cells: myoepithelial cells classified as normal group, light blue cells: myoepithelial cells classified as UDH group, light red cells: myoepithelial cells classified as LG-DCIS group, dark red cells: myoepithelial cells classified as HG-DCIS group.

