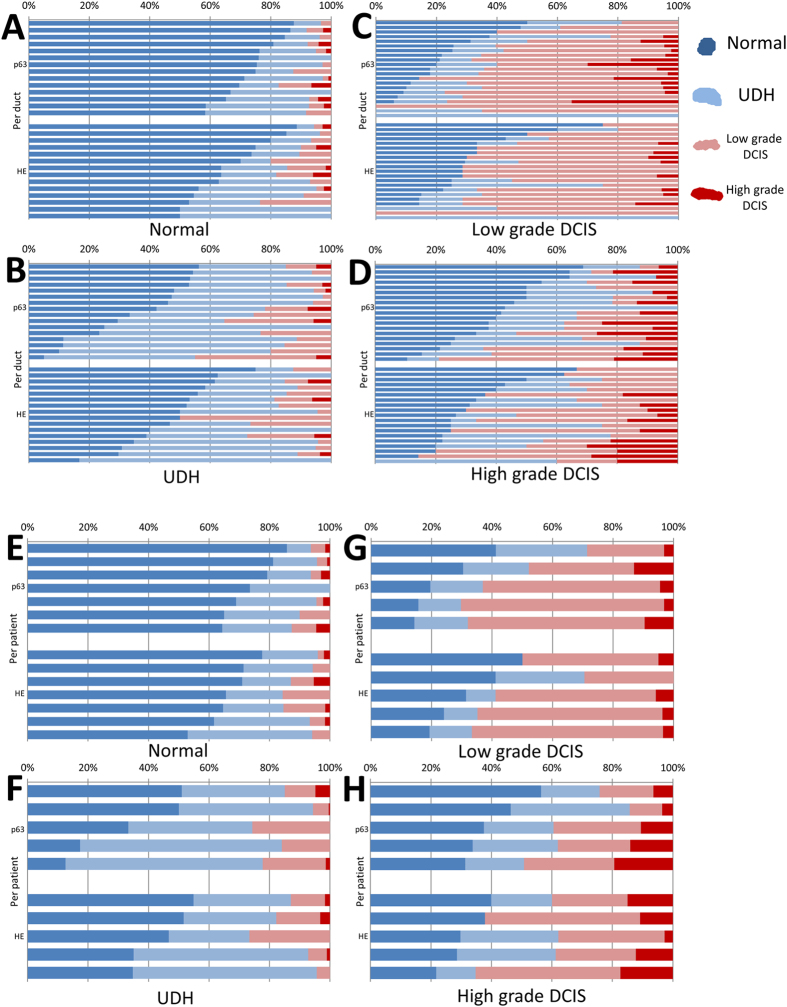
Figure 4. Heterogeneity analysis.
Proportion of myoepithelial cells marked as each histologic type based on SVM classification. (A) Normal group on duct level, (B) UDH group on duct level, (C) LG-DCIS group on duct level, (D) HG-DCIS on duct level, (E) Normal group on patient level, (F) UDH group on patient level, (G) LG-DCIS group on patient level, (H) HG-DCIS on patient level. Dark blue (myoepithelial cells classified as normal group), light blue (cells classified as UDH group), light red (cells classified as LG-DCIS group), dark red (cells classified as HG-DCIS group).

