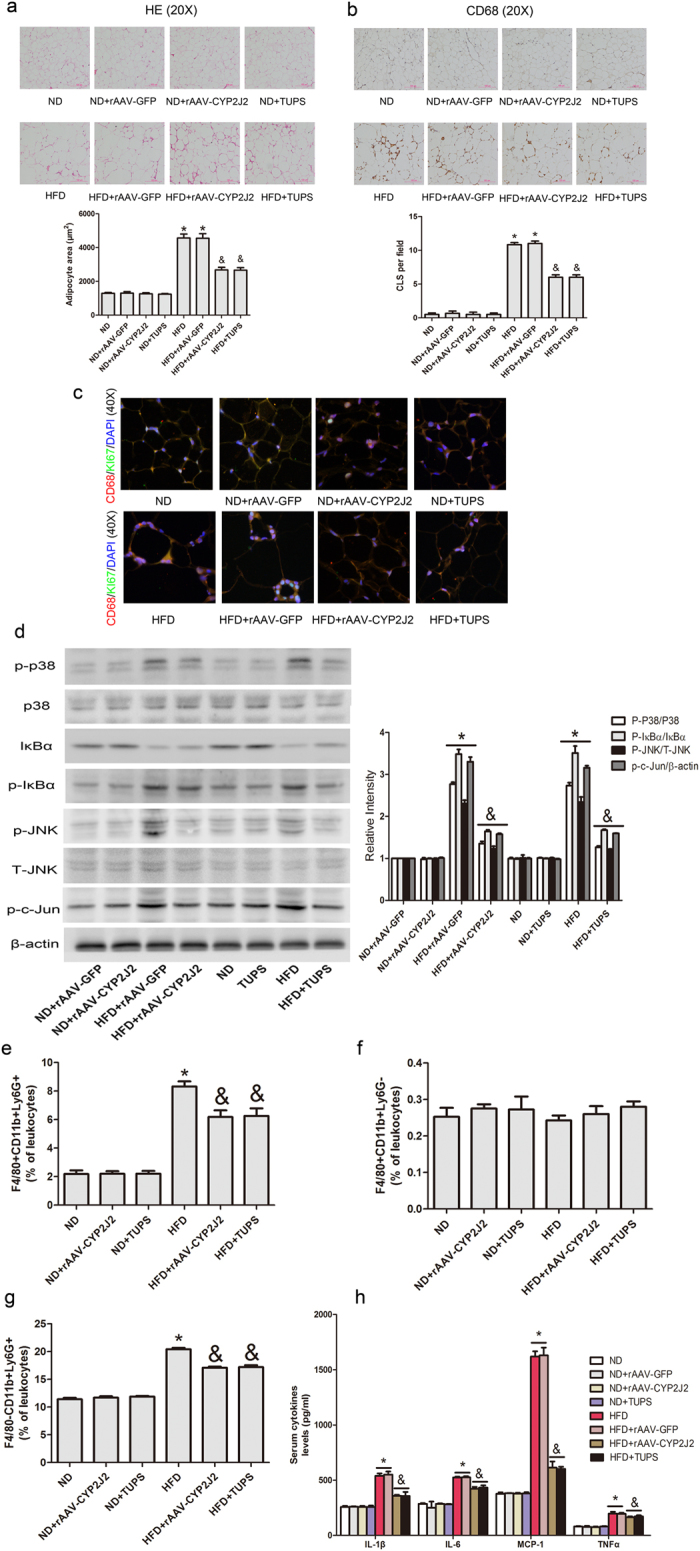
Figure 4. CYP2J2 and TUPS attenuated HFD-induced inflammation in adipose tissue.

(a) Representative images of HE staining in adipose tissue and the calculated average adipocyte area. (b) Representative CD68 immunohistochemical staining and the numbers of CLS in adipose tissue with indicated interventions. (c) Representative images of macrophage proliferation staining with CD68 and Ki67. (d) Representative immunoblots and quantitation for MAPK and NF-κB signaling pathways in adipose tissue. Pro-inflammatory (e) and anti-inflammatory (f) monocytes and neutrophils (g) levels in the circulation. (h) ELISA analysis of inflammatory cytokines in serum. (n = 15 for each group; *p < 0.05 vs ND or ND+ rAAV-GFP; &p < 0.05 vs HFD or HFD+ rAAV-GFP).
