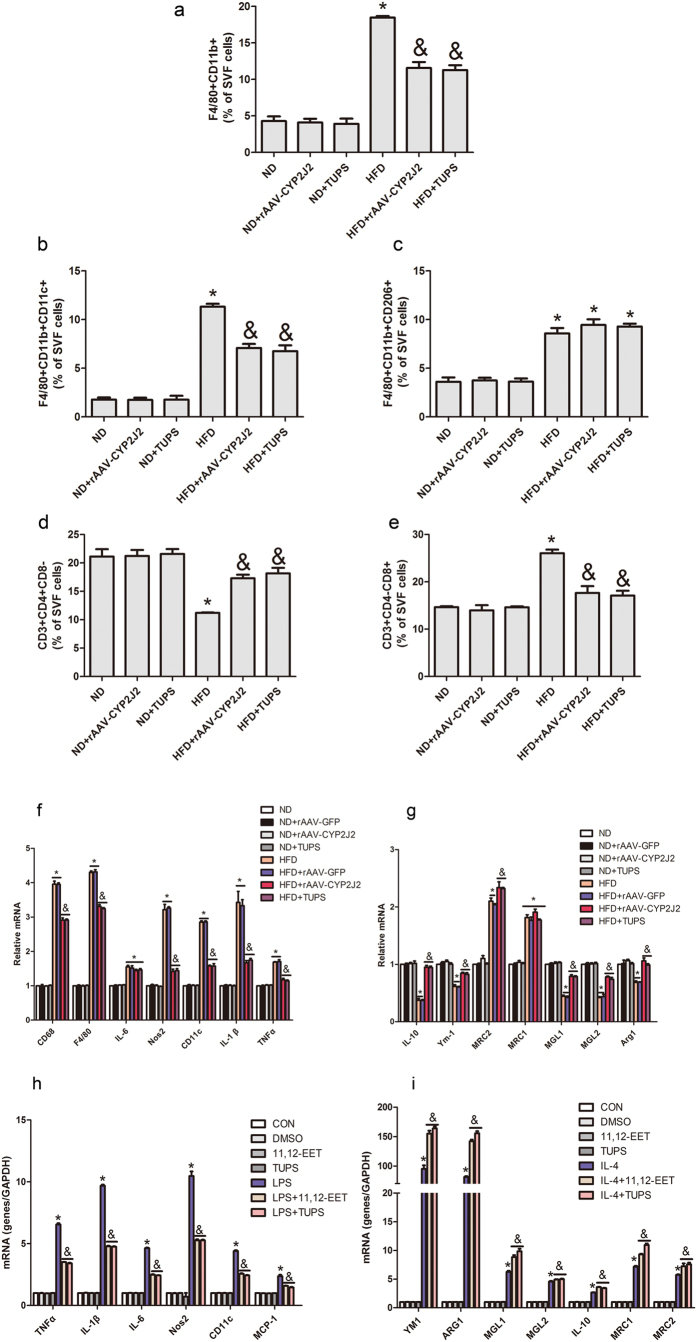
Figure 6. CYP2J2 overexpression and TUPS administration regulated macrophages polarization in adipose tissue.
(a–c) Proportion of total macrophages and the respectively M1 and M2 phenotypes in SVF. (d,e) Proportion of CD4+ or CD8+ T cells in SVF. (f–i) Gene expression of M1 and M2 macrophages related molecules in adipose tissue and BMDMs were analyzed by quantitative real-time PCR. (n = 15 for each group; *p < 0.05 vs ND; &p < 0.05 vs HFD in (a–g); *p < 0.05 vs control; &p < 0.05 vs LPS or IL-4 in (h,i).

