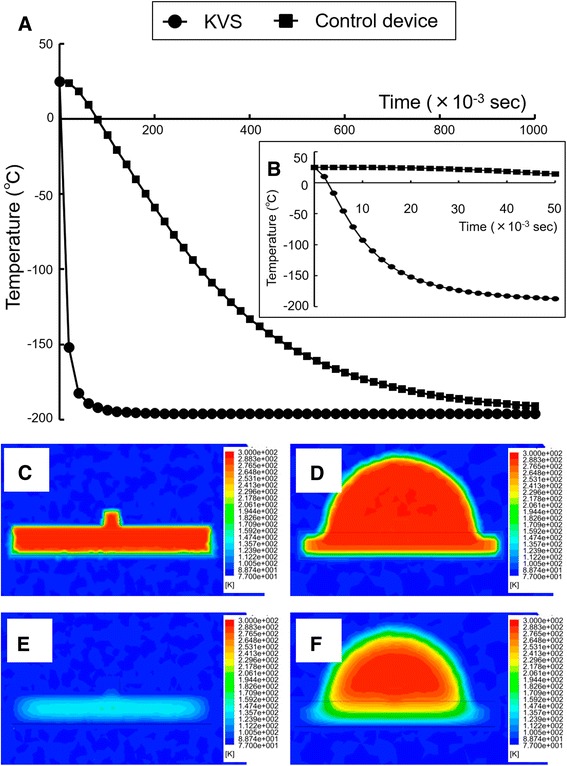
Fig. 3.

The vitrification dynamics of the Kitasato Vitrification System (KVS) and the Control device. a-b: The embryo temperature in the vitrification procedure was calculated using a thermal transfer-based simulation method. The temperature in the center of the embryo during the vitrification procedure was plotted using the simulation result for the KVS and the control device. Temperature changes are shown every 0.02 s from liquid nitrogen (LN2) immersion for 1 s (a) and every 0.002 s from immersion for 0.05 s (b). c-f: Illustration of the thermal distribution of a wide cross-section of embryos on the KVS support (c and e) or the control device sheet (d and f) in the vitrification procedure. Thermal distributions immediately after immersion in LN2 are shown in (c and d). The thermal distributions at 0.05 s after immersion are shown in (e and f)
