
Fig. 2.
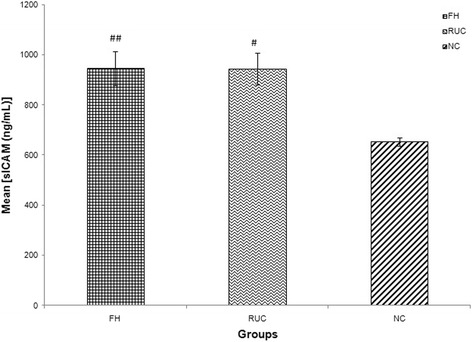
Graph of mean concentration of sICAM-1 in three different groups. Data were expressed as mean ± SEM. FH and RUC groups were higher in sICAM-1 concentration compared to NC. ## indicated p < 0.001 and # p < 0.01 compared to NC; FH: Familial Hypercholesterolaemia; RUC: Related unaffected controls; NC: normolipaemic subjects