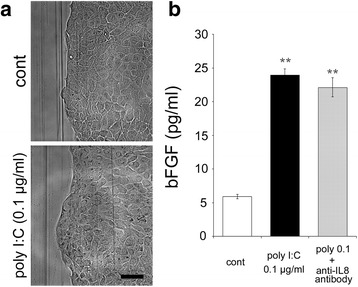
Fig. 5.

Bright field image of migration and protein levels of bFGF. a Representative bright field images on the scratched edge margins with or without 0.1 μg/ml of poly I:C stimulation at 24 h after the scratch. b The bFGF protein concentrations after 24 h of incubation in the culture medium following the scratch and treatment with 0.1 μg/ml of poly I:C with or without anti-IL-8 antibody (n = 3). Data of bright field images are representative of at least three independent experiments. Data are presented as the mean ± SEM. ** p < 0.01 vs. control according to the Tukey-Kramer test. Scale bar: 100 μm
