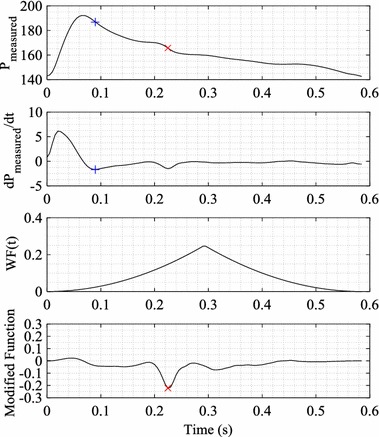
Fig. 3.

Detected maximum negative gradient point (blue +) and detected end systolic point using the modified function (red x) on a single beat pressure waveform. Top panel measured pressure waveform having multiple descending inflection points. Second panel pressure gradient dP measured /dt and detected global minimum, shown as blue cross. Third panel weight function WF(t) applied to dP measured /dt. Bottom panel modified function showing product of dP measured /dt and WF(t), where the red cross shows the identified location of the end systolic point
