Fig. 7.

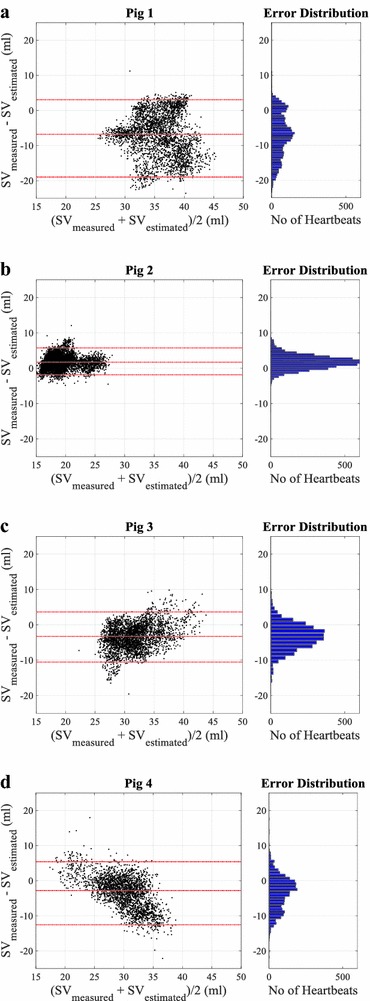
Bland–Altman plots a–d showing agreements between measured and estimated SV for all pigs. Red dashed line showing the bias and 95% interval. Right panel showing the error distribution between measured and estimated SV values

Bland–Altman plots a–d showing agreements between measured and estimated SV for all pigs. Red dashed line showing the bias and 95% interval. Right panel showing the error distribution between measured and estimated SV values