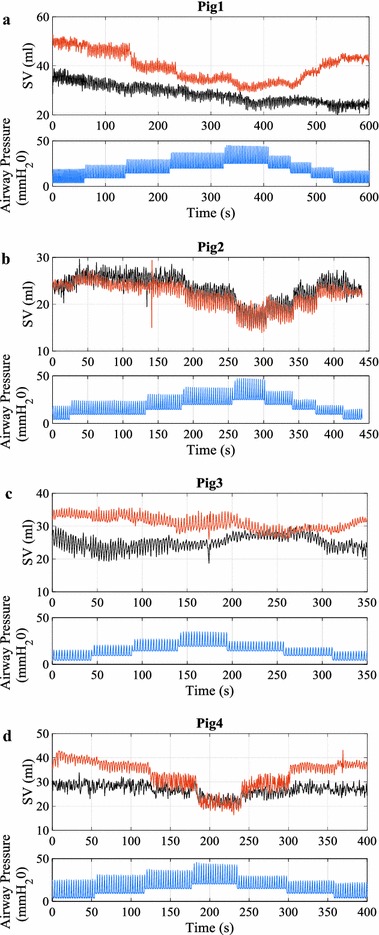
Fig. 8.

Time series plot a–d showing measured and estimated SV in the last RM period of the experiment for all pigs. Top panel measured SV from admittance catheter (black line) and estimated SV using Eq. (13) (red line). Bottom panel simultaneously measured airway pressure showing PEEP changes during recruitment manoeuvers RM (blue line)
