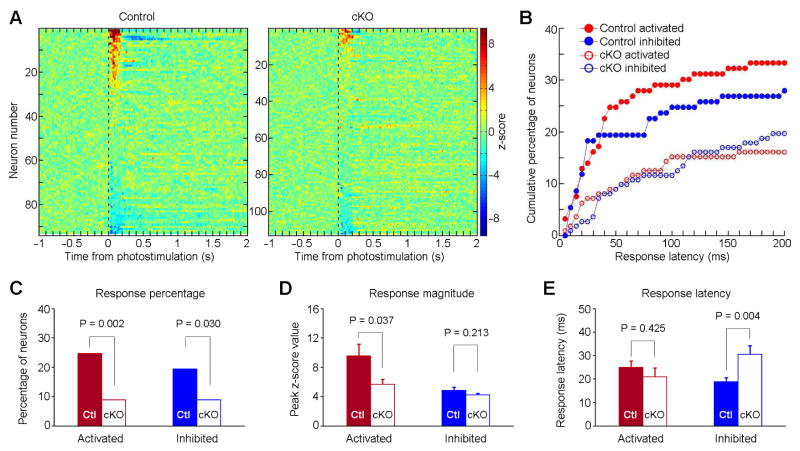
Figure 2. Conditional knockout of VGLUT2 from DA neurons reduces VStr phasic response.
(A) Summary of the z-scored perievent histogram of all the recorded VStr neurons upon VTA optogenetic stimulation in Control (n = 93; left panel) and cKO mice (n = 112; right). Perievent histograms (bin size = 5 ms) were smoothed with a Gaussian filter (filter width = 3 bins). Color bars represent z-scored firing frequency.
(B) Cumulative percentages of the activated (red) and inhibited (blue) VStr neurons with response latencies of 200 ms or less, recorded from Control (filled circles) and cKO mice (open circles).
(C) Percentages of the same four groups of neurons (as shown in B) that responded with latencies of 50 ms or less. A chi-square test was used for statistics. Ctl, Control.
(D) and (E) Response amplitude (D; Mean ± SEM) and response latency (E; Mean ± SEM) of the same four groups of neurons that responded with latencies of 50 ms or less. An unpaired two-tailed t test was used for statistics.

