
Figure 1.
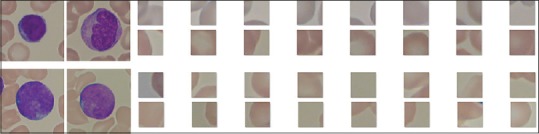
Illustration of illumination/saturation bias in unprocessed images from a dataset describing normal and lymphoblast cells.[28] The large images (left) are two images from each class. Small images (right) are cropped subimages (top left 50 × 50 corner) from 16 images for each class