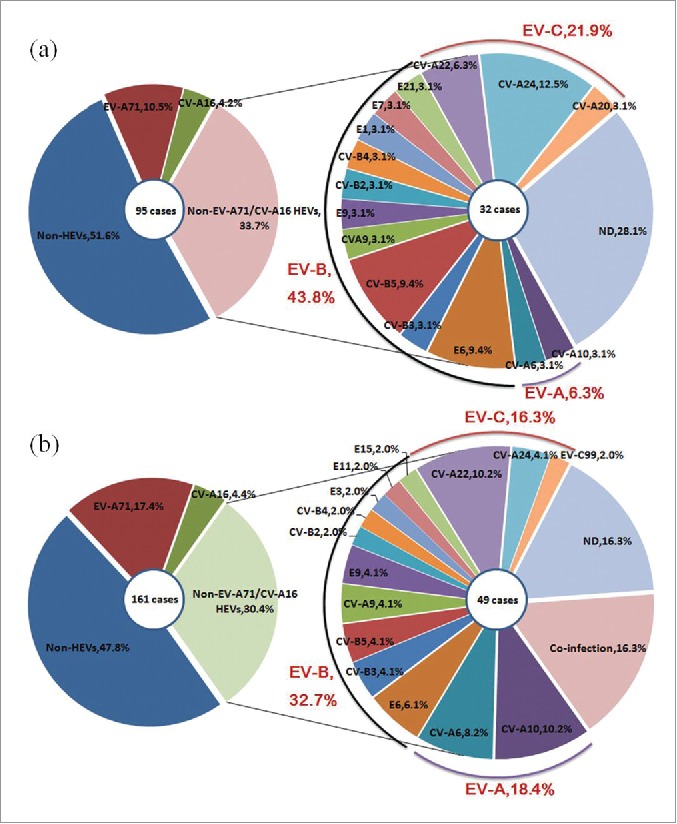
Figure 2.

Distribution of human enterovirus serotypes in Jiangsu, China, 2012–2013.(A) Percentage of 4 different groups of HA patients (left). Percentage of each serotype in HA patients with infected the Non-EV-A71/CV-A16, including co-infection and ND ones (right).(B) Percentage of 4 different groups of HFMD patients (left). Percentage of each serotype in HFMD patients with infected the Non-EV-A71/CV-A16, including co-infection and ND ones (right).
