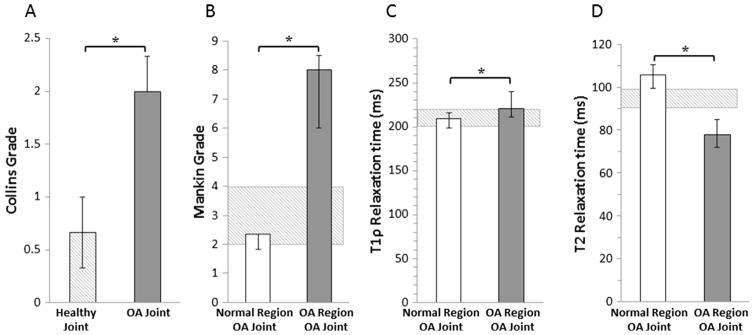
Fig. 1.
Median (A) Collins grades of healthy and OA joints, (B) Modified Mankin grades, (C) T1rho relaxation times, and (D) T2 relaxation times of normal and OA regions of the cartilage from OA joints (*p < 0.05). The error bars show the interquartile range. The hashed box indicates the interquartile range for the healthy joints.

