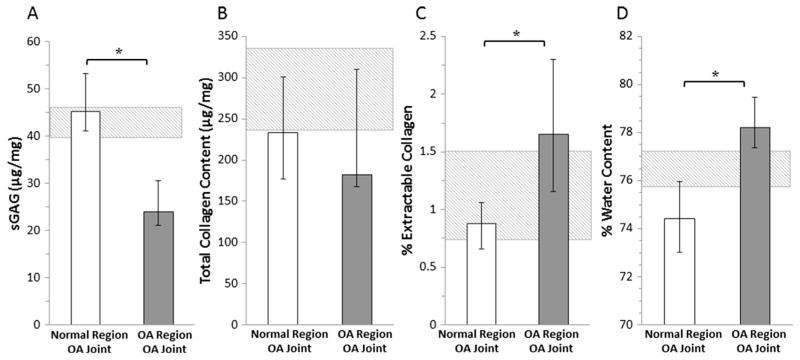
Fig. 3.
Quantification of cartilage biochemical composition showing median (A) sGAG content, (B) Total collagen content, (C) % Extractable collagen, and (D) % Water content of normal and OA regions of cartilage from OA joints (*p < 0.05). The error bars show the interquartile range. The hashed box indicates the interquartile range for the healthy joints.

